
India accounted for 43% and China for 45% of the total number of Drug Master File (DMF) submissions for APIs in 2024. Two geographic areas account for almost 90% of the world's pharmaceutical pipeline. In contrast, the U.S. contributed only 3% of DMF filings, a significant decrease from the 23% of filings it accounted for in the 1980s. If your procurement team is only keeping a track of the cost and quality of your API supply, but not the geography, then you're in the most geopolitically volatile sourcing period in decades.
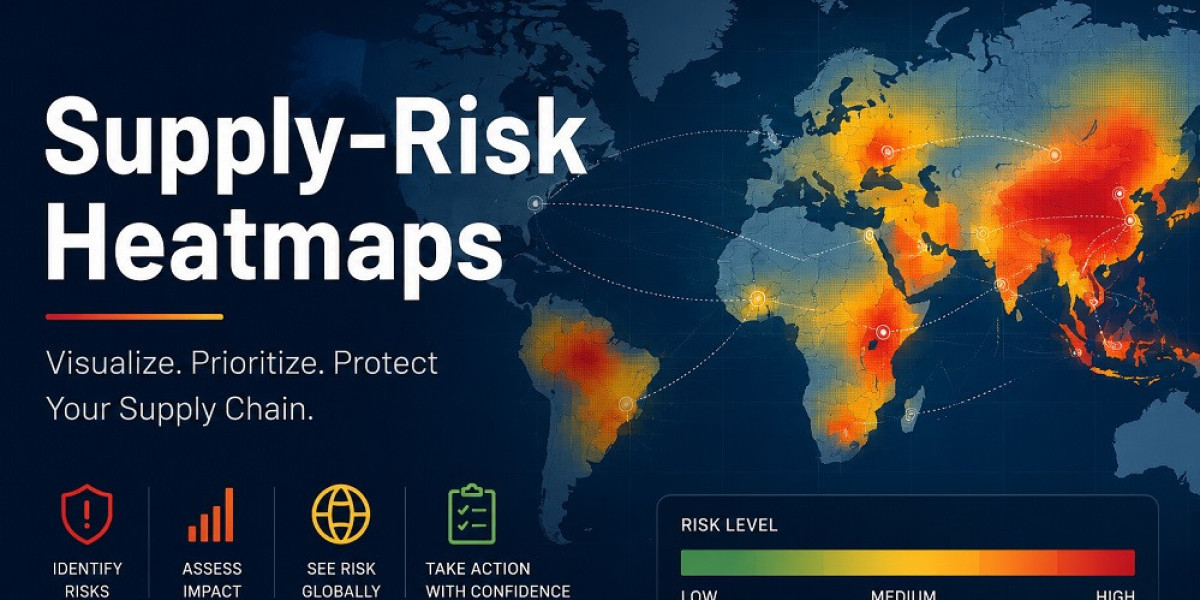
This changes with a supply-risk heatmap. It is a visual prioritization tool that maps your API portfolio against two axes (likelihood of supply disruption and business impact in the event of a disruption) and assigns a red, amber or green zone to your team that indicates where to act first.
This article will make sense of what it tells you, as well as how to act on it with dual sourcing and inventory strategies to achieve real resilience.
The Geography Problem Most Sourcing Teams Miss
The factors most pharmaceutical procurement teams consider when selecting API suppliers are price, quality certifications and lead time. Very few systemically trace the location of those suppliers and fewer still the upstream supply chain of Key Starting Materials (KSMs) that feed into the API.
It lies in the space between them.
Geographic concentration of any pharmaceutical manufacturing anywhere in the world will lead to a higher risk of drug shortages, according to USP's Medicine Supply Map. It's not only about the country your API is from, it's about the choke point logic of the upstream chain. In India for instance, the country is often being touted as the ‘China+1' option in terms of API sourcing. However, about 73% of the Indian pharmaceutical manufacturers' API raw material imports come from China as of H1 FY2026. This supply shock does not just impact APIs that are Chinese origin, it ripples down through supply chains in India as well.
Up to 87% of the antibiotic intermediates are imported from China in India. One restriction, one regulatory measure or one logistical setback at the origin results in chain shortages of generics producers on three continents.
Regulatory filing information (USDMF, CEP/COS, EU API Registered, REACH) show manufacturing locations and may be used to identify your geographic exposure. Many companies have this data and don't employ it for risk analysis. An API sourcing database such as Chemxpert's ChemProtel expressly highlights these certifications per product and country in an organized and searchable format, offering a practical starting point for sourcing and regulatory teams to map their actual supply geography.
The true measure of a Supply-Risk Hotspot
A supply-risk heatmap is a 5×5 matrix which shows risk likelihood along one axis and business impact along the other, as referred to in ISO 31000 (risk management) and ISO 22301 (business continuity). This grid represents one position in each of your APIs. The colour zone it falls into (green, amber or red) indicates how urgent the urgency is.
The heatmap is used to evaluate six key aspects for pharmaceutical API sourcing:
Risk dimension What to measure
Risk Dimension | What to Measure |
Geographic Concentration | % of qualified supply from a single country or region |
Supplier Concentration | Number of qualified API suppliers per product |
Regulatory Status | Active USDMF, CEP/COS, warning letters, GMP non-compliance |
Geopolitical Tariff Exposure | Trade policy risk, export controls, Section 232 exposure |
Logistics Choke Points | Port dependency, shipping lane concentration |
Supplier Financial Health | Capacity utilization, financials, recent news |
The heatmap can be displayed in a categorical manner (as a matrix of your API portfolio) or geographically on a world map with countries with a high concentration of your APIs shaded by risk level. The matrix is designed to assist sourcing and regulatory teams in making product decisions, while the geographic overlay is for leadership to make capital and network-design decisions.
This 5-Step Framework Will Help You Create Your Api Risk Heatmap
This is a 5-step framework for building your API risk heatmap.
Step 1: Map Your API Portfolio Against Registered Supplier Countries
Begin with the top 20-50 APIs (by revenue or patient criticality). List all qualified suppliers and manufacturing country for each product in your API sourcing database. Mark all APIs for which you had 100% qualified supply from one country; these are your top priority sole-sourced products.
Chemxpert's ChemProtel has the ability to filter by active ingredient, country of manufacture and certification type (USDMF, KDMF, CEP/COS, EU API Registered, China API Registered, REACH), thus providing a cross-referenced view of geographic exposure in one place.
In Step 2, score geographic concentration risk by using the following formula
Give each API a concentration number from 1 to 5. Score 1 = diversification of supply in 3+ geopolitical regions. Score 5 indicates that 100% of supply is sourced from one country with no alternative sources specified. In cases of India-origin APIs, add another country-of-origin based check – if the supplier is getting KSMs from China, the real concentration risk is greater than what is indicated by the country of origin data.
Step 3: Score Business Impact
Evaluate each API based on its revenue importance, therapeutic importance, supplier-switchability, and regulatory lead time. For an API with an annual revenue of over $500M and no alternatives in another geography, the impact is 5.If there is no alternative API in another geography, then the impact is 5 for an API with an annual revenue of over $500M. A ten-star generic has 10 suppliers qualified from 4 continents and scores as 10. The quadrant in the heatmap is determined by the impact score and the concentration score.
In Step 4, the Matrix will be created and Red Zones will be identified.
Arrange the APIs in the 5×5 grid. The red zone are APIs in the top right corner (high concentration risk, high business impact). These need to be dealt with immediately. Amber: Monitor closely and start pre-qualification of alternatives – Mid-diagonal APIs. Green APIs in lower left: quarterly monitoring is OK.
Step 5: Validate with Live Regulatory and Market Intelligence
Heatmap using static data will soon be outdated. Ensure that your red and amber zone APIs are cleared with regard to current warning letters (FDA 483s, EMA GMP non-compliance findings), live DMF status, financial news from suppliers and on-time delivery performance. In recent years, however, on-time-in-full (OTIF) delivery rates are as low as 30–40% across the industry — and supplier delivery history is a significant leading indicator of the level of risk from disruption.
Three Risk Patterns to Recognize When Reading Your Heatmap
- Single country sole source is the riskiest: 100% qualified supply from one country no prequalified alternative source. Regulatory, geopolitical, logistical and environmental disruptions mean no buffer when it comes to any shortage.
- Many diversification strategies for China involve the double country exposure of the same upstream origins, which is an unknown effect. Your Indian and European suppliers may be using China as their country-of-origin for their KSMs, so your supply may look diverse at country level, but it is still single-point dependent up the chain. To achieve true risk reduction, the tracing of the supply chain needs to be extended two levels up.
- The new risks trend for 2025-2026 is geopolitical tariff exposure. In 2025 the 20% extra tariff on all US imports from China, along with the Section 232 pharmaceutical national security investigation, can result in APIs from tariff "exposed" geographies becoming economically unviable in a heartbeat. Markets can be closed off quickly, leaving a lack of supply only temporarily covered by safety stocks.
RESPONDING TO THE RED ZONES: Dual Sourcing and Inventory Strategy
When you've determined your red-zone APIs, you have two answers in one, which is to qualify other API suppliers in different geopolitical regions, and to build appropriate inventory buffers as you undergo the qualification process.
Dual sourcing involves qualifying at least two GMP qualified manufacturers located in two different geographical risk zones for each critical API. Across the industry, the industry playbook has changed to "redundancy by design," with dual sourcing, regional diversification, and inventory strategies for critical intermediates becoming standard practice and not treated as a resilience measure.
Dual-source qualification is generally regarded as the industry standard for APIs with annual revenues > $500M. Dual-source agreements should be applied from the start with supply contracts for products that have a commercial potential of over $200M.
The operational value of an API sourcing database is truly evident when it comes to finding candidate suppliers for dual sourcing. Chemxpert's ChemProtel offers more than one million products from 200+ countries, with filters for type of certification, country and manufacture. But before investing in formal qualification, you can use CompFolio to get the financials, manufacturing sites, GMP certifications and warning letter history of your company. ChemDmart, ChemXpert's e-marketplace, allows Chemistry buyers to place direct buying enquiries to qualified suppliers with verified contact information for key decision makers.
The qualification journey includes a regulatory pre-qualification (confirming the supplier possesses and/or has access to the necessary USDMF, CEP or relevant filing), a GMP audit (which can be done through shared audit programs like Intertek), analytical comparability and a regulatory filing update with FDA or EMA. Plan for a regulatory lead time of 12-24 months in establishing timelines.
While dual sourcing is being implemented, inventory buffers are the short-term mitigation. The industry guidance to be followed after 2025 includes tiered safety stocks per API risk classification:
API Tier | Criteria | Recommended Buffer |
Critical (Red Zone) | Single-source, sole geography, life-critical | 6 months or more |
Strategic (Amber Zone) | Dual-sourced, 2 geographies, high revenue | 3–6 months |
Standard (Green Zone) | Multiple suppliers, diversified regions | 4–8 weeks |
The main point to remember is to maintain targets for buffers that are not set in stone but are flexible. AI-driven forecasting sees safety stock calibration that is 20–30% more accurate than statistical forecasting, meaning that organizations can also consider up-to-the-minute demand signals, lead time variability and supplier risk flags without the working capital burden of blanket overstocking.
This Is a Living Document, Not a One-Time Exercise
Geopolitical and trade risk in pharmaceutical supply chains is becoming a regular occurrence. It is structural. Businesses that continue to respond to disruptions in their supply chain (as opposed to proactively anticipating and modeling and managing them) will continue to experience shortages and margin compression in every cycle.
The first step is to create a supply-risk heatmap. What makes it become a decision support tool is its ability to stay current with real-time intelligence—the latest regulatory information, supplier financial updates, price trend analytics, and changes in the DMF.
The platform for Chemxpert is designed for this layer. ChemProtel matches your API geography with certifications in 200+ countries. CompFolio monitors supplier finances, warning letters and pipeline changes. Power BI-based analytics power DataIntel to uncover price trends and market-size signals. The database is continually updated with a 24 hours verification time and a 90% accuracy rate of the data — the intelligence your heatmap relies upon stays fresh.
The sourcing teams that are going to be reasonably safe in the next disruption cycle are the ones that have already understood what their weaknesses are, pre-qualified their backup API vendors and created flexible inventory buffers based on real-time market data. It is now possible to do so with the tools that are available. Waiting is a red zone you never knew.